T1
- Water, such as CSF, as well as dense bone ad air appear dark.[8]
- Fat, such as lipids in the white matter, appear bright
- Pathological processes often increase water content that decreases signal on T1
Brain Tumors are uncontrolled, unnatural growth, and division of brain tissue. They are thankfully not very common but they are one of the most lethal cancers. A Radiologist's job is to diagnose and analyse these tumours in order to provide the best treatment plan. Currently, the time from scan results to report can take in excess of four solid hours [10] and, due to the requirement of highly specialised trained individuals, these are done back-to-back reducing accuracy.
Cases each year (US): 15,000
Median Survival: 14.6 months
Five-year surivival rate: < 10%
High-grade malignant brain tumors generally lead to short life expectancy and limited treatment. The aggressive nature of this illness necessitates efficient diagnosis and treatment plans to improve the quality of and extend patient life. Automatic segmentation methods which are fast and reliable in clinical settings are vital for these tasks. Algorithmic segmentation is a particularly challenging task.
As the most common diagnostic tool for brain tumors due to it's non-invasive nature and ability to image diverse tissue types and physiologogical processes.
There is a need for accurate and fully automated methods. Manual segmentation around tumour margins on a slice-by-slice basis can take 12 minutes or more per tumor per sequence, with semi-automatic methods taking 3-5 mins [5]. Automated segmentation that is not vulnerable to operator subjectivity may be beneficial [6].
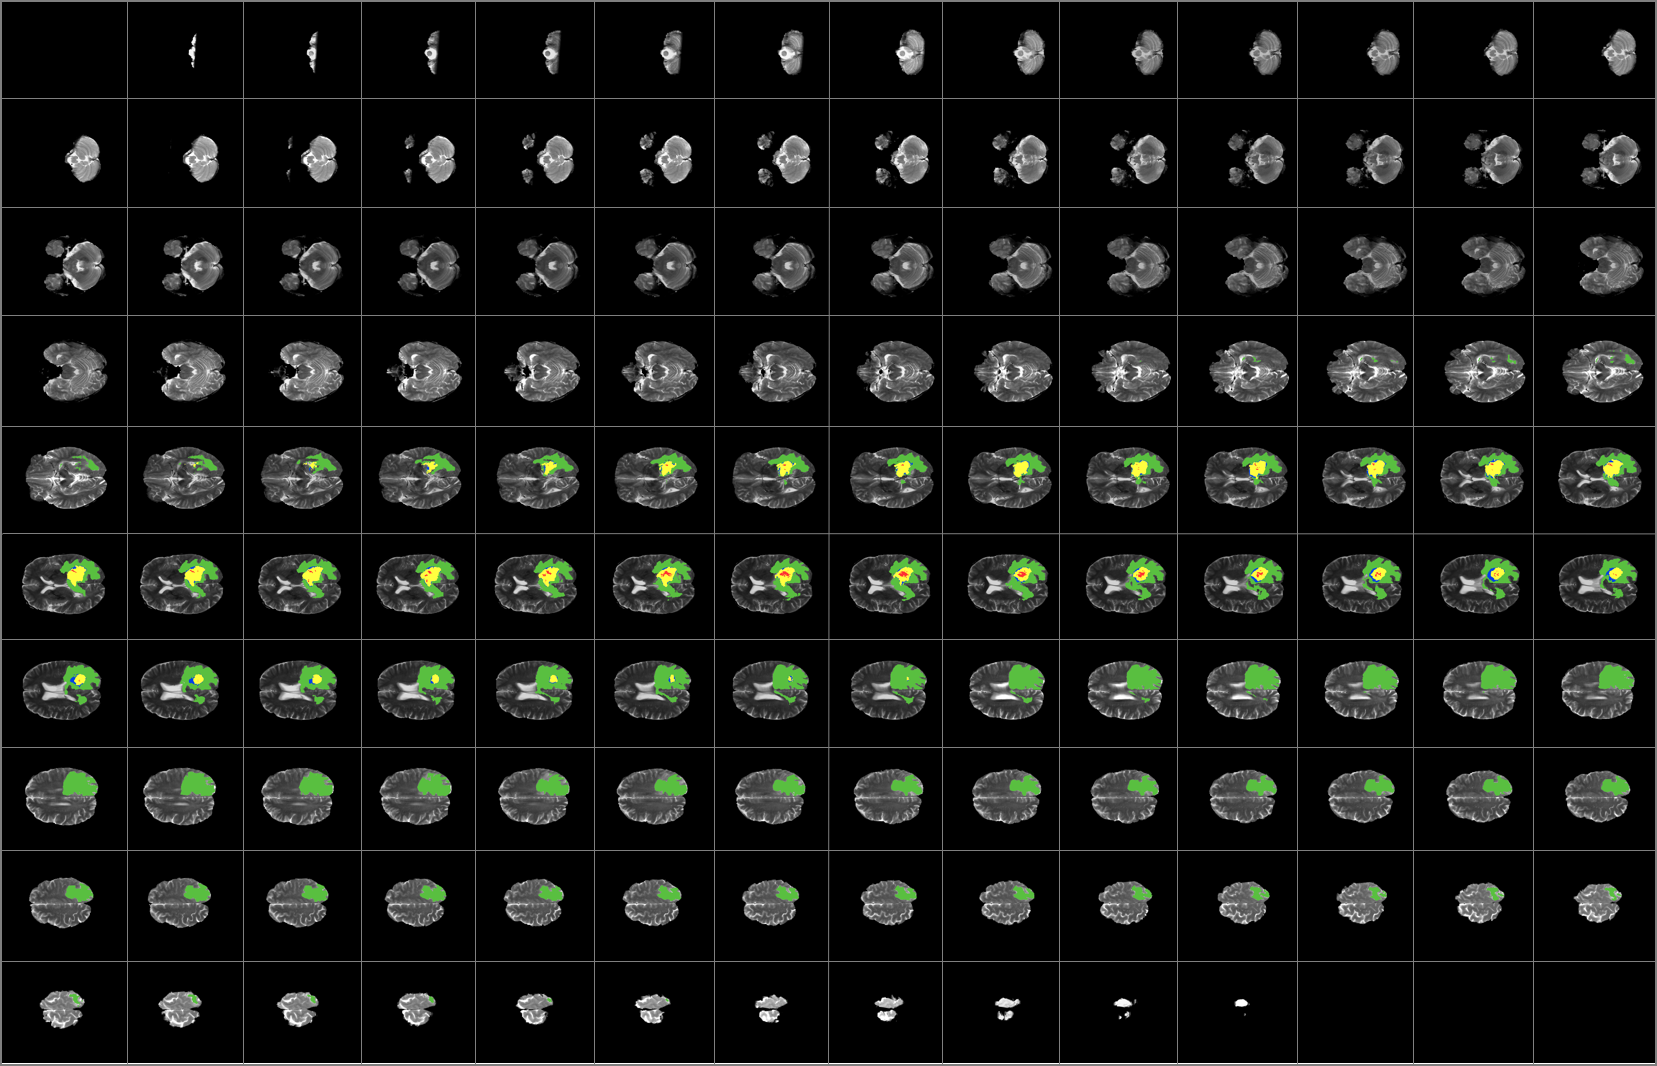
MRI uses a magnetic gradient and radio frequency pulses to take repetitive axial slices of the brain and reconstruct a 3-dimensional representation. Each brain scans 155 slices giving as 155 2D images which represent the 3D brain with each slice constituting of 1mm3 voxel.
An MRI can be defined as a function I(i, j) in 2D space or I(i, j, k) in 3D space, where i, j, k denote spatial coordinates. The values of the functions are intensity values and are typically represented by a grey value between 0 and 255. Every image consists of a finite set of image elements called pixels in 2D space or voxels in 3D space. Each image element is uniquely specified by its intensity value and its coordinates (i, j) for pixels and (i, j, k) for voxels, where i is the row number, j is the column number, and k is the slice number in a volumetric stack.
Same as T1 but with higher signal on contrast-agent which is taken up by pathological processes.
Flair images have a signal from free fluid - such as cerebrospinal fluid in the ventricles - is supressed (compare T2 and FLAIR). High signal seen on these images indicates a pathological process such as infection, tumor or areas of demyelination.
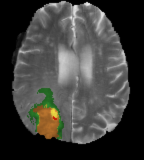
Gliomas typically originate within white matter and thus exhibit growth along white matter fibres, as a result they have irregular boundaries that are indistinct on conventional magnetic resonance.
BraTS dataset incoporates the use of T1, post-contrast T1-weighted (T1Gd) and T2-weighted (T2) and T2 Fluid Attenuated Inversion Recovery (FLAIR) [9] which are unique radio frequency pulse sequences that exploits the distinct chemical and physiological characteristics of various tissue types to increase contrast.
These are necessary to determine volume and growth-rate of tumors and hence determine their grade.